Weekly AI-Powered Work Summary
Start the day, capture tasks, review, and archive, then summarize using AI
Project Overview #
Role: Lead Product Designer & Product Manager
Type: Feature extension, personal productivity tool
Stack: React, TypeScript, Tailwind CSS, Google Gemini API (Timetraked); OpenAI GPT 5.5, Docker (Weekly Report Generator)
Status: Shipped, in daily use. The Weekly Report Generator runs in Docker and is currently private, with plans to make it public.
About Timetraked #
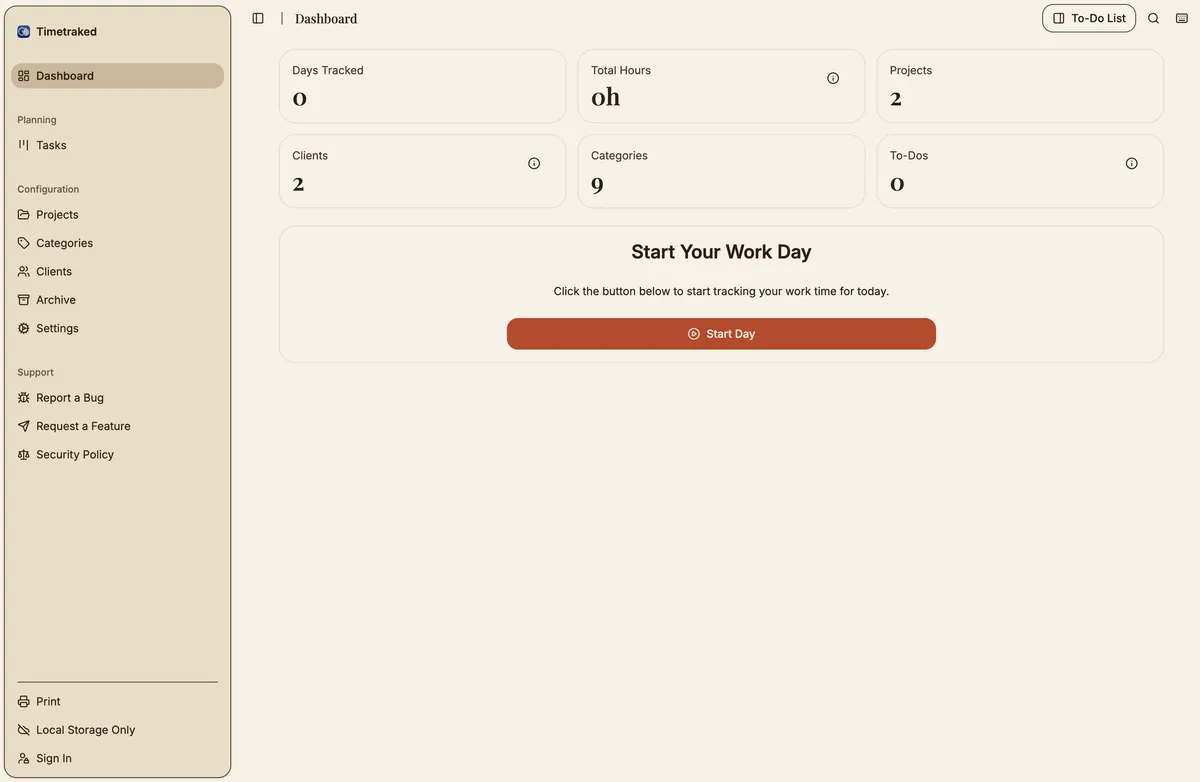
Timetraked (formerly TimeTracker Pro) is a Progressive Web App (PWA) I designed, built, and use every day to track how I spend my work hours. It runs in the browser, installs as a native-like application on desktop and mobile, and stores data locally by default, with no account required. Through the day I create tasks, assign them to projects and categories, and archive each completed day. Over time, it builds a personal record of where my time actually goes.
I built it because every time tracking tool that I tried was either too complex for my personal use, or too simple to be useful. Timetraked is purpose-built for the way I work: start the day, capture tasks as they happen, and review and archive at the end. It has been in daily use since early 2025 and has grown into a small, but complete, product, with export formats, project management, offline support, and invoicing. The Weekly Report feature is the most recent addition, and the one that most clearly shows how the product has evolved from a personal utility into a considered system.
The Weekly Report Feature #
After archiving each week, I found myself running a second, separate tool to generate a weekly summary. That tool only worked with PDFs directly exported from the time tracker, only ran on a local development server, and produced output that always needed manual cleanup before it was shareable. It was a workaround, not a product.
The Weekly Report feature replaces that entire workflow. It lives inside Timetraked as a dedicated route, directly reading the same data the rest of the app uses, and generates a coherent weekly narrative using an AI model (Gemini). The output can be tuned for different audiences, such as a team’s standup, a client update, or a personal retrospective, and is editable before copying to a separate document. No export step, no separate server, no manual cleanup.
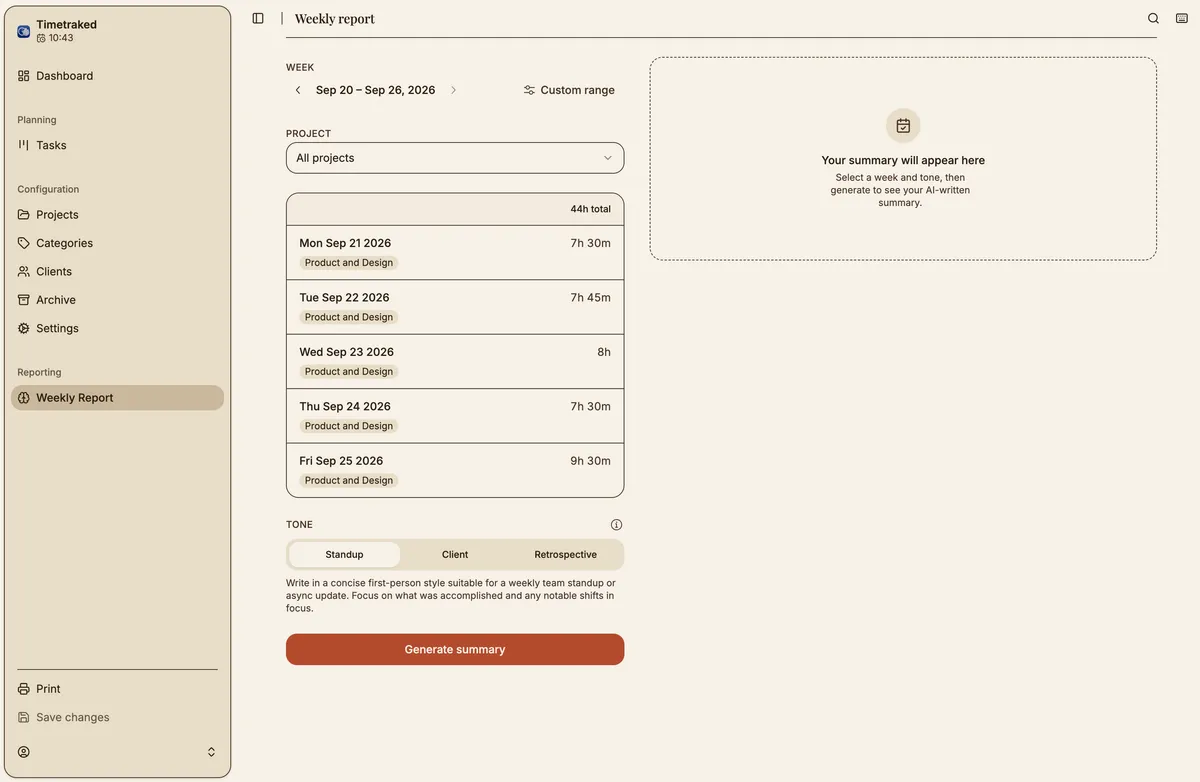
The right tool for summarizing my work week is the tool that already knows my work week.
The Problem #
The original two-tool setup had three specific friction points:
- No real integration
- Availability
- Output always requiring editing
-
The generator only accepted PDFs from the time tracker, creating a dependency without any actual data sharing. The export was the only bridge between them.
-
The generator ran on a local Vite server, which meant it was only accessible from my machine and only in a single context. Any time I needed a summary on a different device, I was out of luck.
-
Because the generator had no understanding of who I was writing for, every summary came out generic and required manual work to make it usable. The generator sounded too similar from week-to-week, diminishing the quality of the reports.
The deeper problem was that the tooling made a simple, recurring task feel like a project in itself. I needed a paragraph that I could drop into a standup or send to a client. What I had was a process.
Extend, Not Replace #
The obvious move might have been to build a better standalone summary tool, but I chose not to, and the reasoning matters.
A standalone tool would still need an export step, a file upload, or an API connection to access my time data. It would have to be general enough to work with any input, which means losing all the context that makes a summary actually useful: what categories mean, which projects are billable, and what a typical week looks like, specifically for me.
Extending Timetraked meant the summary feature could read directly from the same local data store the rest of the app uses. No synchronization problem. No format negotiation. The data is already structured exactly the way the feature needs it to be: tasks with descriptions, projects, categories, and duration, grouped by day.
It also meant the feature could be opinionated in ways that a generic tool cannot. It knows to exclude break-time and lunch categories automatically. It understands the project and client structure. It has enough context to group a week of task descriptions into a meaningful narrative rather than a list.
Two Tools, One Deliberate Boundary #
The short weekly summary and the full weekly report do different jobs, so I split them. The summary lives inside Timetraked because it reads the daily time entries straight from the same database, which means no export step and no syncing. The Weekly Report Generator is a separate tool. You paste in the summary from Timetraked, and the AI writes a full report from a template built into the system.
The hardest question was whether to fold the generator into Timetraked too. I kept it separate so it could work with any summary, not only ones tied to one tool’s data format, and so its use cases could grow over time. Timetraked is where the data lives, but the generator has no dependency on it.
The cost is maintainability. A separate project means another repository, another set of dependencies, and another thing I have to fix when it breaks. It also adds a copy-and-paste step between the two tools, which is the price of the boundary. I accepted both to keep the generator reusable.
The template is built in for now, and making it easy to customize for different outputs is the next item on the list. The generator runs in a Docker container today and is currently private, with plans to make it public.
Design Decisions #
The goal was to make the AI feel like a step in a workflow, not a magic trick.
Two-panel Layout #
At wider viewports, the report page uses a two-column layout: controls on the left, output on the right. This came from recognizing that the interaction has two distinct modes, configuring the request and reviewing the result, and that collapsing them into a single scrolling column would blur that separation.
The left column handles week navigation, the data breakdown, and tone selection. It is the setup side. The right column is purely reactive: it shows whatever state the output is in: idle, generating, error, or a draft summary ready to edit and copy. Nothing in the right column requires user input; it only responds to decisions made on the left.
This separation also meant each column could be designed for its specific job. The left column is dense and interactive. The right column has more breathing room because reading and editing require it.
The generation flow as a design experience #
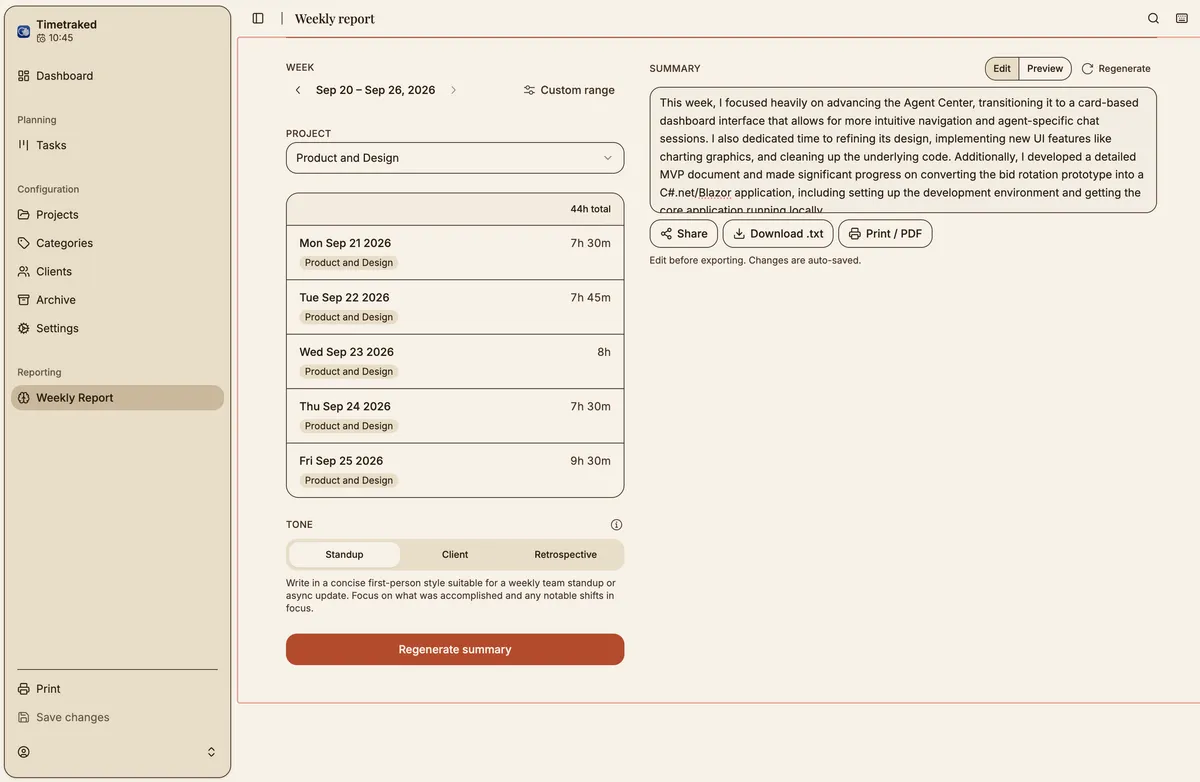
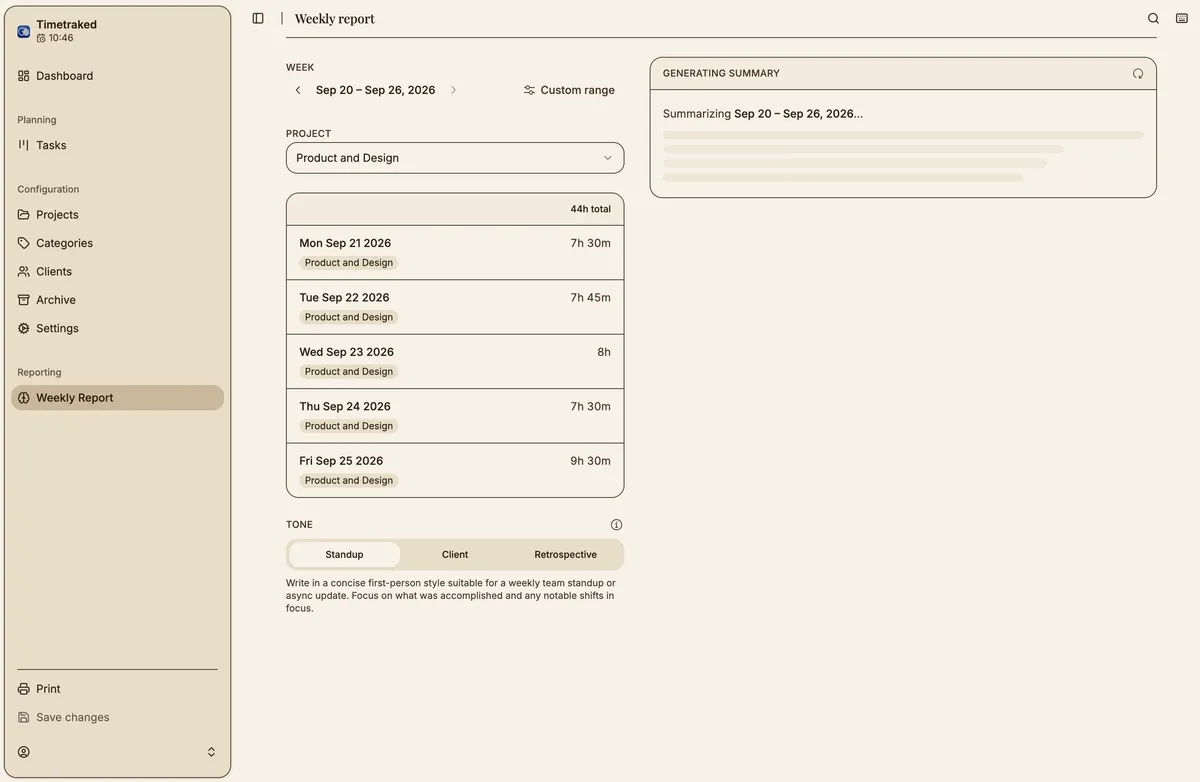
The most deliberate UX decision was treating the AI generation as a visible, legible transition rather than a black-box button press. When generation is in progress, the right panel names the week being summarized and shows staggered skeleton lines that suggest an output is forthcoming.
The idle state, before anything has been generated, uses a dashed border container with a short explanation of what will appear there. This keeps the two-column layout from reading as broken or incomplete on first load, and gives the right panel a purpose even before it has content.
Error states are structured and recoverable: a header that names the failure, a plain-language description, and a “Try again” action inline. The error is informative without being alarming.
Tone as a product decision #
The tone selector (Standup, Client, Retrospective) reflects a real choice I make every week about who I’m writing for. These are not cosmetic variations. Each tone maps to a different set of system prompt instructions sent to the model, producing meaningfully different outputs.
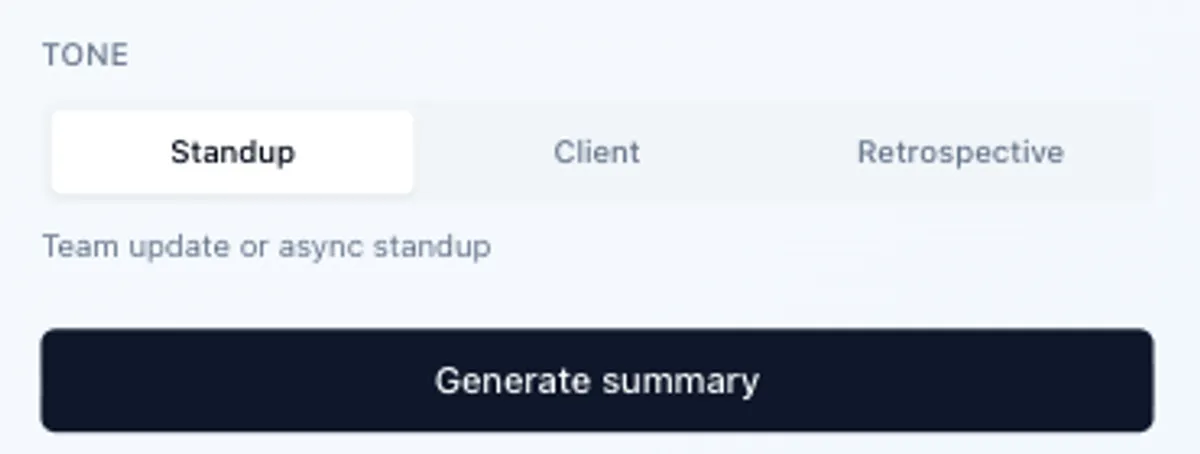
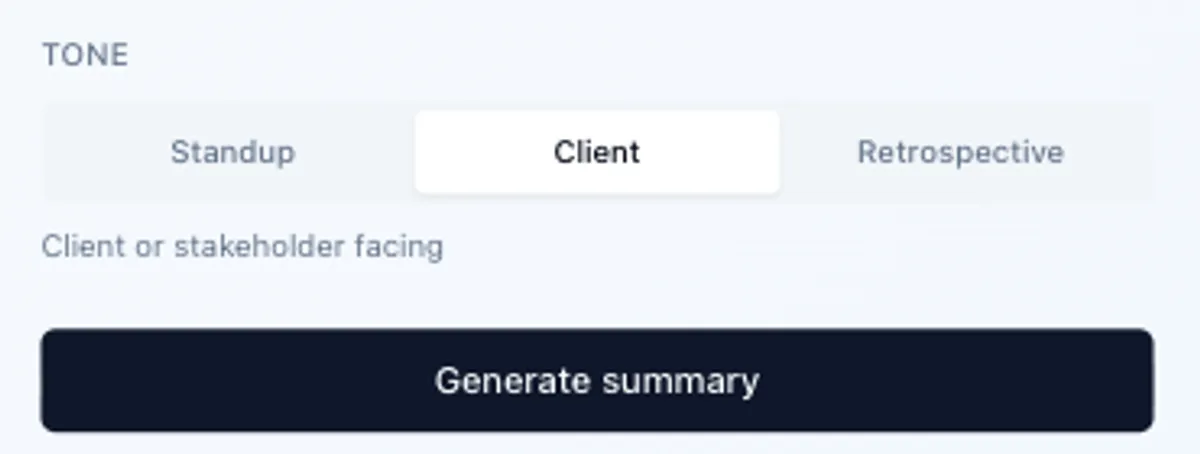
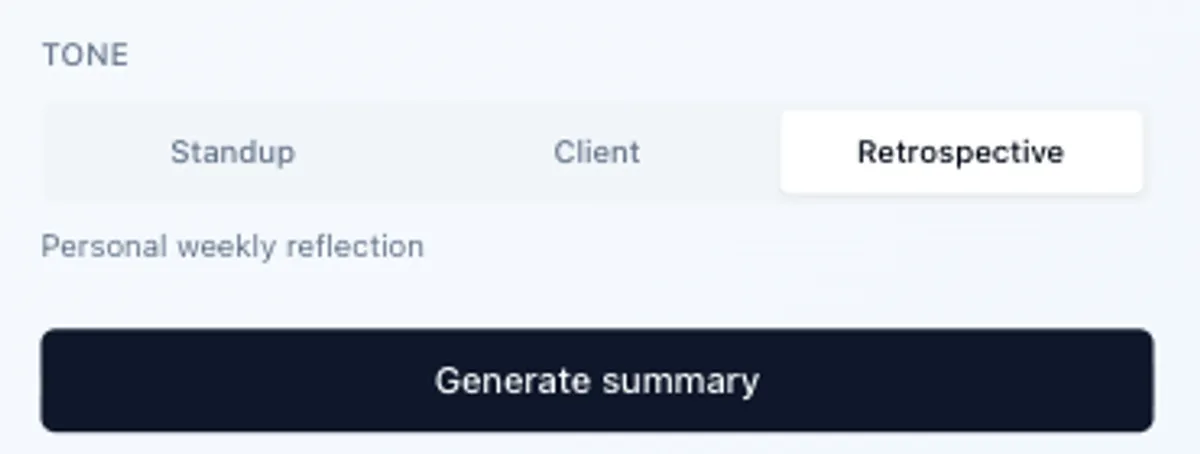
Having tone as an explicit control also solves a subtle UX problem: when you change the tone, the existing summary resets so you never mistake a standup summary for a client-ready output. The control communicates its own consequences.
Editable output by default #
The generated summary appears in an editable text area, rather than a read-only display. This frames the AI’s role correctly: it drafts, the human approves. The copy button and a brief ‘changes are not saved’ note completes the mental model: this is a staging area, not a final product.
A “regenerate” button sits alongside the copy button, so it is easy to get a different draft without scrolling back to the controls. The two actions, regenerate and copy, represent the two things a person actually wants to do with a draft: try again or take it.
AI prompt architecture #
The prompt that drives the summary is split into two parts. The system instruction establishes the persona, length constraints (3 to 5 sentences), voice (first-person, no filler phrases), and the specific tone instructions for whichever mode is selected. The user message contains the serialized week data: a lean, human-readable representation of each workday with task titles, descriptions, project names, and durations.
Before sending, the serialization step strips timestamps, IDs, and non-work categories. What reaches the model is only what a human would include if they were writing the summary prompt by hand. This matters because model output quality is directly proportional to input clarity: sending structured noise produces structured noise back.
The prompt architecture is designed to evolve. As I use the feature and notice patterns in what I edit or regenerate, the system instructions can be tuned to match how I actually write and what different audiences respond to. The tone categories themselves may expand: a sprint summary or executive update tone would be natural additions as the use cases grow.
Outcome #
Every week I use the standup tone on Monday morning to orient myself before the week’s work begins, with the retrospective tone on Friday to close out the week. Before this feature existed, I skipped that ritual more often than not due to the fact that the tooling made it feel like work. Now it takes less than a minute. The summary is available wherever Timetraked is available, and the tone control means the output is usually usable with one or two edits rather than a full rewrite.
The Weekly Report Generator extends that routine. I use it every week, and it takes less than a minute to produce a full report that used to take me about 30 minutes to write by hand.
From a portfolio standpoint the project demonstrates a specific combination of skills: identifying friction in a real workflow, making a considered architectural decision about where a feature belongs, designing the interactions states that make AI output feel trustworthy, and shipping something that has been in daily use since it launched.